
Key Sections
What Is a Data Science Internship Like?
What are the Benefits of an Internship in Data Science?
- Hands-On Experience: You’ll gain practical skills working with real-world datasets and industry-standard tools
- Skill Development: Internships help you hone your technical abilities in data collection, analysis, and interpretation
- Industry Exposure: You’ll learn about current practices, challenges, and trends in Data Analysis across different sectors
- Networking Opportunities: Build connections with professionals and fellow interns that can lead to future job prospects
- Career Exploration: Discover which areas of Data Analysis you’re most passionate about pursuing
Categories
- Accounting & Finance
- Accounting Staffing Agency
- AI Recruiting
- AI Technology
- Android Developer
- Bookkeping services
- Cash Application Staff
- Data Analyst Staffing Agency
- Finance Recruitment Agency
- Find a job
- Full Stack Developer
- Hire Talent
- Hire Data Analyst
- IT Staff Augmentation
- IT Staffing
- Permanent Recruitment Vs. Temporary Staffing
- Sage Business Cloud Accounting
- Salesforce Recruitment Agency
- Salesforce Staffing
- Tech Recruiter
- Workday Accounting Staff
- Accounts Receivable
What to Expect as a Data Analyst Intern
- Collecting and cleaning data from various sources
- Performing statistical analyses and creating data visualizations
- Assisting with report generation and presentation of findings
- Collaborating with team members on ongoing projects
- Learning and applying new analytical techniques and tools
How Do I Stand Out When Applying for a Data Analyst Internship?
- Gain proficiency in programming languages like Python or R
- Familiarize yourself with Data Analysis tools such as SQL, Excel, Power BI, or Tableau
- Hone your communication skills to effectively present findings to both technical and non-technical audiences
- Demonstrate your proficiency in SQL, Python, or R with clean, readable code
- Showcase multiple projects using different analytical techniques and tools
- Provide examples of data visualizations and dashboards you’ve created
- Included details of your problem-solving process and insights derived from your analyses
- Highlight any relevant coursework or personal projects that demonstrate your skills
Data Analyst Internship Interview Questions

Q1) What is data wrangling and how is it useful?
Q2) Define data mining and data profiling
Data Mining: Data mining is the process of discovering patterns, relationships, or insights from large datasets using statistical and machine learning algorithms. It helps in extracting useful information that can drive decision-making and predictions.
Data Profiling: Data profiling involves examining and analyzing data to determine its structure, accuracy, completeness, and consistency. It helps in understanding data characteristics and identifying data quality issues.
Q3) Explain the steps involved in an analytics project
- Defining Objectives: Establish clear goals and objectives for the analysis
- Gathering Data: Collect data from various sources relevant to the project
- Cleaning Data: Prepare and clean the data to ensure accuracy and consistency
- Analyzing Data: Use statistical and analytical techniques to examine the data
- Interpreting Results: Draw insights and conclusions from the analysis
- Implementing Insights: Apply the findings to make informed decisions and improvements
Q4) What are the common problems faced during Data Analysis?
- Managing vast amounts of data
- Collecting meaningful data
- Selecting the right analytics tool
- Data visualization challenges
- Handling data from multiple sources
- Ensuring data quality
- Addressing skills gaps in Data Analysis
Q5) Which tools have you used for Data Analysis and presentation?
- Microsoft Power BI: For creating and sharing reports and dashboards
- Tableau: For data visualization and sharing insights
- Excel: For spreadsheet analysis and basic visualizations
- Python: Using libraries like Pandas and Matplotlib for data manipulation and visualization
- Google Data Studio: For integrating and visualizing data from various Google services
Q6) How do you clean data?
- Remove Duplicate or Irrelevant Observations: Eliminate any duplicated or unnecessary data points
- Fix Structural Errors: Correct inconsistencies in data entry, such as typos or incorrect formats
- Filter Unwanted Outliers: Identify and handle outliers that may skew the analysis
- Handle Missing Data: Address missing values by either removing them or imputing them based on other observations
- Validate and QA: Ensure data accuracy and consistency through validation checks
Q7) What is exploratory Data Analysis (EDA)?
Q8) Describe univariate, bivariate, and multivariate analysis
- Univariate Analysis: This involves analyzing a single variable. It focuses on describing the data, identifying patterns, and summarizing the main characteristics using measures like mean, median, mode, and visualizations like histograms.
- Bivariate Analysis: This examines the relationship between two variables. It includes methods like correlation and regression analysis, and visualizations like scatter plots to understand how one variable affects another.
- Multivariate Analysis: This involves analyzing more than two variables simultaneously. Techniques like multiple regression, factor analysis, and principal component analysis help in understanding complex relationships among multiple variables.
Q9) Explain the concept of outlier detection
Q10) What are the ethical considerations of Data Analysis?
- Privacy: Ensuring data confidentiality and respecting user privacy
- Bias: Avoiding biases in data collection and analysis
- Transparency: Being clear about methodologies and limitations
- Consent: Obtaining proper consent for data use
- Accuracy: Ensuring data accuracy and integrity
- Security: Protecting data from unauthorized access and breaches
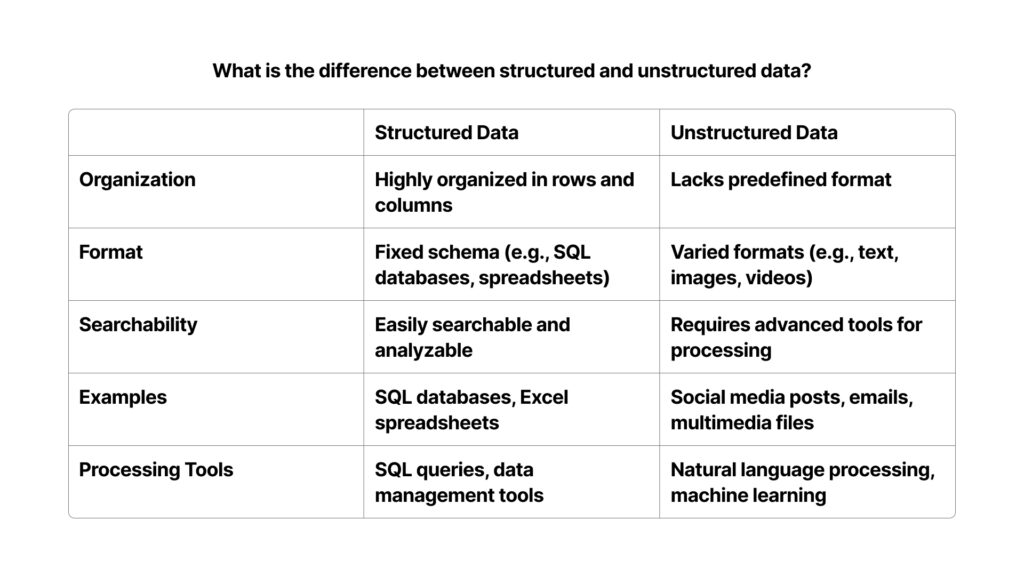
Q11) What is the difference between structured and unstructured data?
Q12) Describe the process of data cleaning
- Remove Duplicate or Irrelevant Observations: Eliminate duplicates and irrelevant data
- Fix Structural Errors: Correct inconsistencies such as typos and incorrect formatting
- Filter Unwanted Outliers: Identify and handle outliers appropriately
- Handle Missing Data: Address missing values through removal or imputation
- Validate and QA: Ensure data accuracy and reliability through validation checks
Q13) How do you handle missing data in a dataset?
- Listwise Deletion: Remove rows with missing values if the proportion is small
- Imputation: Replace missing values with mean, median, or mode
- Predictive Models: Use algorithms to estimate missing values
- Indicator Method: Create a binary indicator for missing values
- Interpolation: Estimate values in time series data
Q14) Explain the term “data normalization”
Q15) What is the significance of data visualization?
Q16) How do you create a pivot table in Excel?
- Select Data: Highlight the range of data you want to use
- Insert Pivot Table: Go to the “Insert” tab and click “PivotTable”
- Choose Data Range: Confirm the data range in the “Create PivotTable” dialog box
- Select Location: Choose where to place the pivot table (new worksheet or existing one)
- Build Pivot Table: Drag and drop fields into the “Rows,” “Columns,” “Values,” and “Filters” areas to organize your data
Q17) What is the VLOOKUP function in Excel?
Q18) Explain the term “hypothesis testing”
- Formulating the null (H0) and alternative (H1) hypotheses
- Selecting a significance level (alpha)
- Calculating the test statistic
- Determining the p-value
- Comparing the p-value to the significance level to decide whether to reject the null hypothesis
Q19) Describe the types of sampling techniques
- Simple Random Sampling: Every member of the population has an equal chance of being selected
- Systematic Sampling: Selecting every nth member from a list after a random start
- Cluster Sampling: Dividing the population into clusters and randomly selecting entire clusters
- Stratified Sampling: Dividing the population into strata and randomly sampling from each stratum
- Judgmental or Purposive Sampling: Selecting samples based on the researcher’s judgment
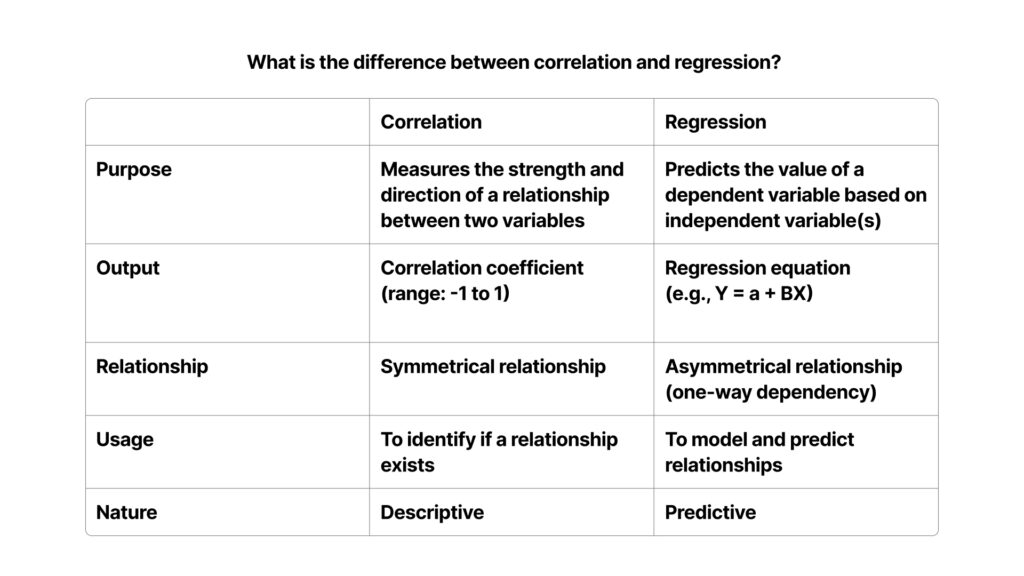
Q20) What is the difference between correlation and regression?
Q21) How do you perform a time series analysis? ?
- Data Collection: Gather data points collected at consistent time intervals
- Data Cleaning: Remove any anomalies or inconsistencies
- Visualization: Plot the data to identify patterns or trends
- Decomposition: Break down the series into trend, seasonal, and residual components
- Modeling: Apply models like ARIMA, Exponential Smoothing, or others to forecast future values
- Validation: Validate the model using historical data to ensure accuracy
Q22) What are the steps in a Data Analysis process?
- Understanding the Problem: Define the problem and objectives
- Collecting Data: Gather relevant data from various sources
- Cleaning Data: Remove or correct any errors and inconsistencies
- Exploring and Analyzing Data: Use statistical and visualization techniques to identify patterns and insights
- Interpreting Results: Draw conclusions and make recommendations based on the analysis
- Communicating Findings: Present the results to stakeholders in an understandable format
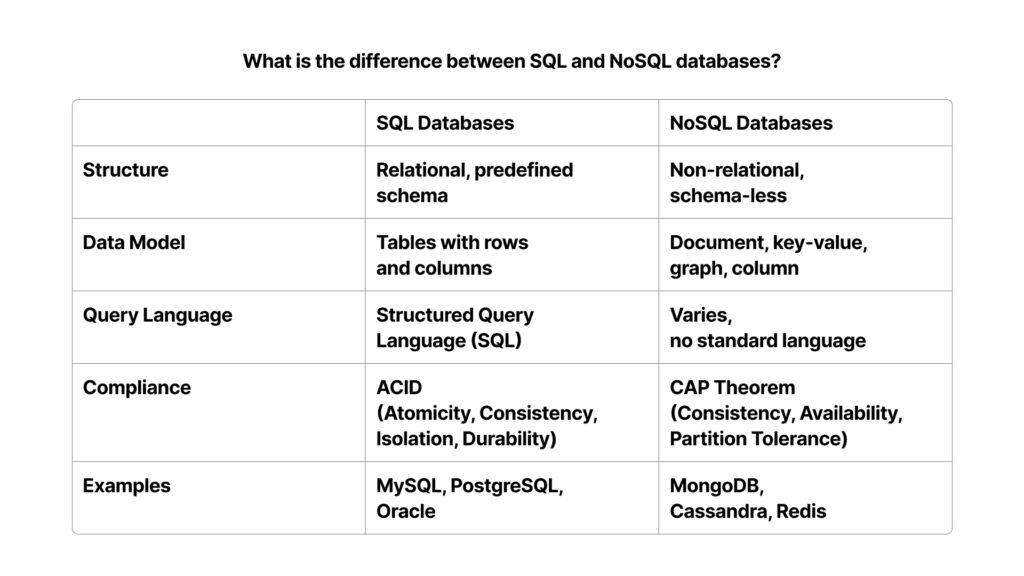
Q23) What is the difference between SQL and NoSQL databases?
Tips for Success During Your Internship

The steps in a Data Analysis process typically include:
- Be proactive and take initiative on projects
- Ask questions and seek feedback from your supervisors and colleagues
- Keep learning and stay updated on industry trends and new technologies like machine learning and artificial intelligence expertise
- Document your work and achievements for future portfolio entries
- Network with professionals in your organization and a variety of industries to broaden your prospects of an entry-level position
Let VALiNTRY Help You Kickstart Your Data Analyst Career
Although there is significant demand for qualified Data Science professionals, finding a position that matches you as a candidate to an organization’s need and culture can be challenging. This is where the Data Analyst recruiters at VALiNTRY can help. We have relationships with top employers and match Data Analyst candidates of all levels with the perfect opportunities.
So, once your internships are complete and you’re ready to get started finding your first Data Science job, reach out to our Data Analyst recruiting team.