
Organizations of all sizes are seeking to leverage the mountains of customer and market data they own to their competitive advantage. With this greater emphasis on data-driven decision making, there is high demand for junior Data Analysts with hundreds of entry-level positions across a wide variety of industries available on Indeed and other job boards.
You might be asking, what is a career in Data Science like? What does a Data Analyst do? How much do Data Analysts get paid? What questions should I expect when I interview for a Data Analyst job?
The Data Analyst recruiters at VALiNTRY hear these questions all the time, so, they put this job search guide and list of interview questions together for those looking to start their Data Science careers.
Key Sections
Is a Career in Data Science a Good Choice?
Data Science offers a range of career opportunities across various industries, including Finance, Healthcare, Technology, and Retail. Key roles in this field include:
- Data Analyst: Analyzes data to provide actionable insights and support business decision-making
- Business Intelligence Analyst: Develops and manages BI solutions, creating reports and dashboards to enhance business processes
- Data Scientist: Utilizes advanced analytics, machine learning, and statistical methods to interpret complex data
- Data Engineer: Designs, constructs, and maintains data pipelines and infrastructure
- Quantitative Analyst: Applies mathematical models to analyze financial data and manage risks
Categories
- Accounting & Finance
- Accounting Staffing Agency
- AI Recruiting
- AI Technology
- Android Developer
- Bookkeping services
- Cash Application Staff
- Data Analyst Staffing Agency
- Finance Recruitment Agency
- Find a job
- Full Stack Developer
- Hire Talent
- Hire Data Analyst
- IT Staff Augmentation
- IT Staffing
- Permanent Recruitment Vs. Temporary Staffing
- Sage Business Cloud Accounting
- Salesforce Recruitment Agency
- Salesforce Staffing
- Tech Recruiter
- Workday Accounting Staff
- Accounts Receivable
The most common role in Data Science is that of Data Analyst. All careers in Data Science stem from this role so, we will focus our discussion on Data Science in general but Data Analysts in particular.
What Does a Data Analyst Do?
A Data Analyst is responsible for transforming raw data into structured information to drive strategic business decisions. They do their job by leveraging their proficiency in Python, SQL, and database management and their Strong problem-solving skills, attention to detail, and analytical abilities. Their responsibilities include:
- Data Collection and Cleaning: Gathering data from primary and secondary sources, ensuring data accuracy by filtering and handling missing values
- Data Analysis: Using statistical tools to explore and analyze data, identifying patterns, relationships, and trends
- Data Visualization: Creating visual representations of data findings through charts, graphs, and dashboards
- Reporting: Preparing reports and presentations to communicate insights to stakeholders
- Collaboration: Working with other departments to understand their data needs and provide data-driven solutions
What Specific Skills Does an Entry-Level Data Analyst Need to be Successful?
To succeed in an entry-level Data Analyst role, you should be familiar with:
- Data analysis tools and programming languages (e.g., SQL, Python, R)
- Basic statistical analysis
- Data visualization techniques
- Business intelligence tools
- Excel and other spreadsheet applications
Some positions may also require knowledge of big data technologies like Hadoop and Apache Spark, as well as cloud computing concepts.
Why Are Data Analysts Important?
Data Analysts are indispensable in interpreting complex data to help businesses make informed decisions. Specifically, Data Analysts play a crucial role in:
- Strategic Decision-Making: Providing insights that guide business strategies and improve outcomes
- Improving Efficiency: Identifying inefficiencies within operations to streamline processes and reduce costs
- Enhancing Customer Experiences: Analyzing customer data to understand behaviors and preferences, leading to better products and services
- Risk Management: Identifying potential risks and challenges, enabling businesses to devise strategies to mitigate these risks
Tips for Landing Your First Data Analyst Job
- Build a strong portfolio showcasing your data analysis projects
- Gain practical experience through internships or freelance work
- Network with professionals in the field
- Stay updated on the latest data analysis trends and technologies
- Tailor your resume and cover letter to highlight relevant skills and experiences
Understanding what jobs are available, what a typical Data Analyst does, and how to position yourself as the best candidate, let’s turn to questions you might face once you begin the interview process.
Entry-Level Data Analyst Interview Questions

Q1) What is data wrangling and how is it useful?
Data wrangling, also known as data cleaning, scrubbing, or remediation, involves transforming raw data into a usable format. This process includes discovering, structuring, cleaning, enriching, validating, and publishing data. It ensures data reliability and completeness, making it ready for analysis and helping to derive accurate insights. Data wrangling is crucial as it prepares data by removing flaws and inconsistencies, enabling businesses to make data-driven decisions effectively.
Q2) Define data mining and data profiling
Data Mining: Data mining is the process of discovering patterns, relationships, or insights from large datasets using statistical and machine learning algorithms. It helps in extracting useful information that can drive decision-making and predictions.
Data Profiling: Data profiling involves examining and analyzing data to determine its structure, accuracy, completeness, and consistency. It helps in understanding data characteristics and identifying data quality issues.
Data Profiling: Data profiling involves examining and analyzing data to determine its structure, accuracy, completeness, and consistency. It helps in understanding data characteristics and identifying data quality issues.
Q3) Explain the steps involved in an analytics project
The key steps in an analytics project are:
- Defining Objectives: Establish clear goals and objectives for the analysis
- Gathering Data: Collect data from various sources relevant to the project
- Cleaning Data: Prepare and clean the data to ensure accuracy and consistency
- Analyzing Data: Use statistical and analytical techniques to examine the data
- Interpreting Results: Draw insights and conclusions from the analysis
- Implementing Insights: Apply the findings to make informed decisions and improvements
Q4) What are the common problems faced during data analysis?
Common problems faced during data analysis include:
- Managing vast amounts of data
- Collecting meaningful data
- Selecting the right analytics tool
- Data visualization challenges
- Handling data from multiple sources
- Ensuring data quality
- Addressing skills gaps in data analysis
Q5) Which tools have you used for data analysis and presentation?
I have experience using several tools for data analysis and presentation, including:
- Microsoft Power BI: For creating and sharing reports and dashboards
- Tableau: For data visualization and sharing insights
- Excel: For spreadsheet analysis and basic visualizations
- Python: Using libraries like Pandas and Matplotlib for data manipulation and visualization
- Google Data Studio: For integrating and visualizing data from various Google services
These tools have been essential in analyzing data, generating insights, and presenting findings effectively.
Q6) How do you clean data?
Data cleaning involves several key steps to ensure the accuracy and usability of data:
- Remove Duplicate or Irrelevant Observations: Eliminate any duplicated or unnecessary data points
- Fix Structural Errors: Correct inconsistencies in data entry, such as typos or incorrect formats
- Filter Unwanted Outliers: Identify and handle outliers that may skew the analysis
- Handle Missing Data: Address missing values by either removing them or imputing them based on other observations
- Validate and QA: Ensure data accuracy and consistency through validation checks
Q7) What is exploratory data analysis (EDA)?
Exploratory Data Analysis (EDA) involves analyzing and investigating data sets to summarize their main characteristics using visual methods. It helps in understanding data patterns, detecting anomalies, testing hypotheses, and checking assumptions. EDA is crucial for ensuring the appropriateness of statistical techniques and providing insights that guide further analysis. Developed by John Tukey in the 1970s, EDA remains a fundamental step in the data discovery process today.
Q8) Describe univariate, bivariate, and multivariate analysis
Univariate, bivariate, and multivariate analyses are key statistical methods:
- Univariate Analysis: This involves analyzing a single variable. It focuses on describing the data, identifying patterns, and summarizing the main characteristics using measures like mean, median, mode, and visualizations like histograms.
- Bivariate Analysis: This examines the relationship between two variables. It includes methods like correlation and regression analysis, and visualizations like scatter plots to understand how one variable affects another.
- Multivariate Analysis: This involves analyzing more than two variables simultaneously. Techniques like multiple regression, factor analysis, and principal component analysis help in understanding complex relationships among multiple variables.
Q9) Explain the concept of outlier detection
Outlier detection is the process of identifying data points that deviate significantly from the rest of the dataset. These anomalies can indicate errors, novel insights, or fraudulent activities. Techniques for outlier detection include statistical methods, clustering, and machine learning algorithms. Detecting and addressing outliers ensures the accuracy and reliability of data analysis, preventing skewed results.
Q10) What are the ethical considerations of data analysis?
Ethical considerations in data analysis include:
- Privacy: Ensuring data confidentiality and respecting user privacy
- Bias: Avoiding biases in data collection and analysis
- Transparency: Being clear about methodologies and limitations
- Consent: Obtaining proper consent for data use
- Accuracy: Ensuring data accuracy and integrity
- Security: Protecting data from unauthorized access and breaches
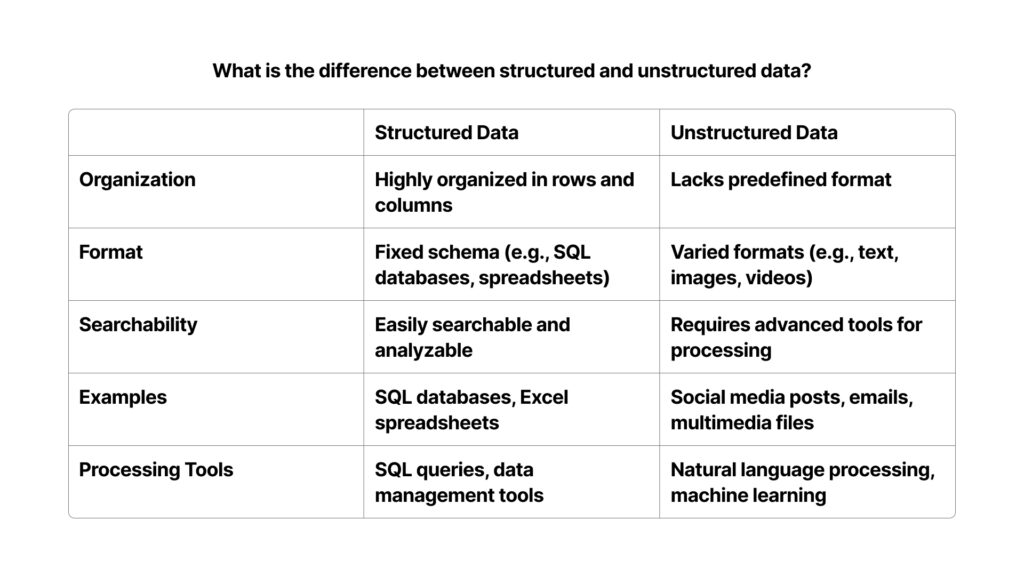
Q11) What is the difference between structured and unstructured data?
Here is a table summarizing the differences between structured and unstructured data:
Q12) Describe the process of data cleaning
Data cleaning involves several steps to ensure data quality and usability:
- Remove Duplicate or Irrelevant Observations: Eliminate duplicates and irrelevant data
- Fix Structural Errors: Correct inconsistencies such as typos and incorrect formatting
- Filter Unwanted Outliers: Identify and handle outliers appropriately
- Handle Missing Data: Address missing values through removal or imputation
- Validate and QA: Ensure data accuracy and reliability through validation checks
Q13) How do you handle missing data in a dataset?
To handle missing data in a dataset, I typically use the following methods:
- Listwise Deletion: Remove rows with missing values if the proportion is small
- Imputation: Replace missing values with mean, median, or mode
- Predictive Models: Use algorithms to estimate missing values
- Indicator Method: Create a binary indicator for missing values
- Interpolation: Estimate values in time series data
These techniques help maintain the integrity of the dataset and ensure accurate analysis.
Q14) Explain the term “data normalization”
Data normalization is the process of organizing data to reduce redundancy and improve data integrity. It involves structuring a database in a way that eliminates duplicate data and ensures data dependencies are logical. The goal is to minimize anomalies during data operations like insertion, deletion, and updating. Normalization typically followsrules called normal forms, ranging from the first normal form (1NF) to higher forms like the third normal form (3NF).
Q15) What is the significance of data visualization?
Data visualization is crucial as it transforms complex data sets into visual representations like charts and graphs. This makes it easier to understand trends, patterns, and insights at a glance. It helps in communicating information effectively to stakeholders, identifying outliers, and making informed decisions quickly. Visualizations enhance data comprehension, making it accessible to a broader audience, including those without a technical background.
Q16) How do you create a pivot table in Excel?
To create a pivot table in Excel, follow these steps:
- Select Data: Highlight the range of data you want to use
- Insert Pivot Table: Go to the “Insert” tab and click “PivotTable”
- Choose Data Range: Confirm the data range in the “Create PivotTable” dialog box
- Select Location: Choose where to place the pivot table (new worksheet or existing one)
- Build Pivot Table: Drag and drop fields into the “Rows,” “Columns,” “Values,” and “Filters” areas to organize your data
Q17) What is the VLOOKUP function in Excel
The VLOOKUP function in Excel is used to search for a value in the first column of a table and return a value in the same row from a specified column. It’s useful for looking up and retrieving data from a table. The syntax is `VLOOKUP(lookup_value, table_array, col_index_num, [range_lookup])`, where `lookup_value` is the value to search, `table_array` is the table range, `col_index_num` is the column number to return the value from, and `range_lookup` is optional to find an exact or approximate match.
Q18) Explain the term “hypothesis testing”
Hypothesis testing is a statistical method used to determine if there is enough evidence to reject a null hypothesis about a population parameter. It involves the following steps:
1. Formulating the null (H0) and alternative (H1) hypotheses
2. Selecting a significance level (alpha)
3. Calculating the test statistic
4. Determining the p-value
5. Comparing the p-value to the significance level to decide whether to reject the null hypothesis
2. Selecting a significance level (alpha)
3. Calculating the test statistic
4. Determining the p-value
5. Comparing the p-value to the significance level to decide whether to reject the null hypothesis
Q19) Describe the types of sampling techniques
Types of sampling techniques are:
- Simple Random Sampling: Every member of the population has an equal chance of being selected
- Systematic Sampling: Selecting every nth member from a list after a random start
- Cluster Sampling: Dividing the population into clusters and randomly selecting entire clusters
- Stratified Sampling: Dividing the population into strata and randomly sampling from each stratum
- Judgmental or Purposive Sampling: Selecting samples based on the researcher’s judgment
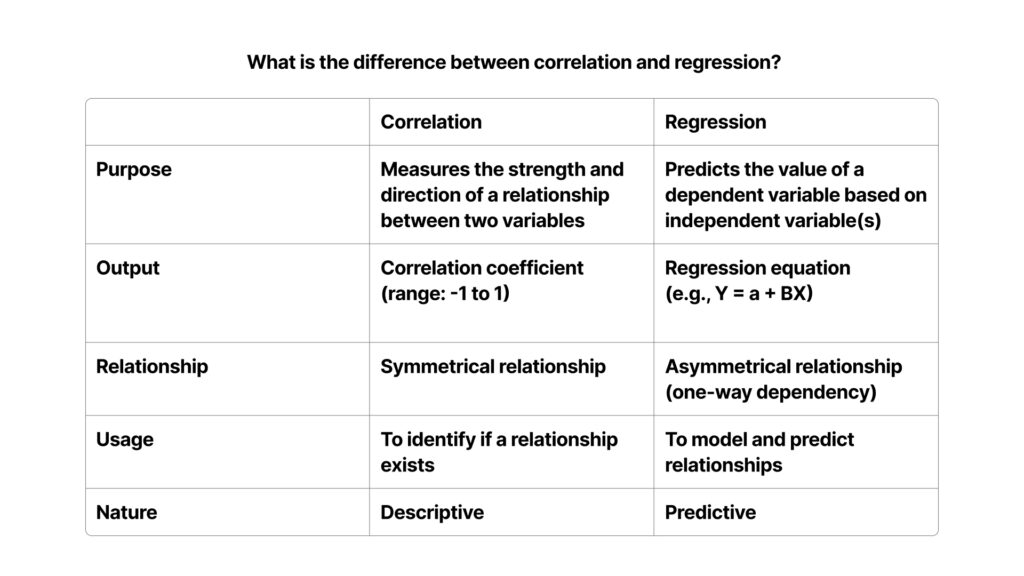
Q20) What is the difference between correlation and regression?
Here is a table summarizing the difference between correlation and regression:
Q21) How do you perform a time series analysis?
Time series analysis involves several key steps:
- Data Collection: Gather data points collected at consistent time intervals
- Data Cleaning: Remove any anomalies or inconsistencies
- Visualization: Plot the data to identify patterns or trends
- Decomposition: Break down the series into trend, seasonal, and residual components
- Modeling: Apply models like ARIMA, Exponential Smoothing, or others to forecast future values
- Validation: Validate the model using historical data to ensure accuracy
Q22) What are the steps in a data analysis process?
The steps in a data analysis process typically include:
- Understanding the Problem: Define the problem and objectives
- Collecting Data: Gather relevant data from various sources
- Cleaning Data: Remove or correct any errors and inconsistencies
- Exploring and Analyzing Data: Use statistical and visualization techniques to identify patterns and insights
- Interpreting Results: Draw conclusions and make recommendations based on the analysis
- Communicating Findings: Present the results to stakeholders in an understandable format
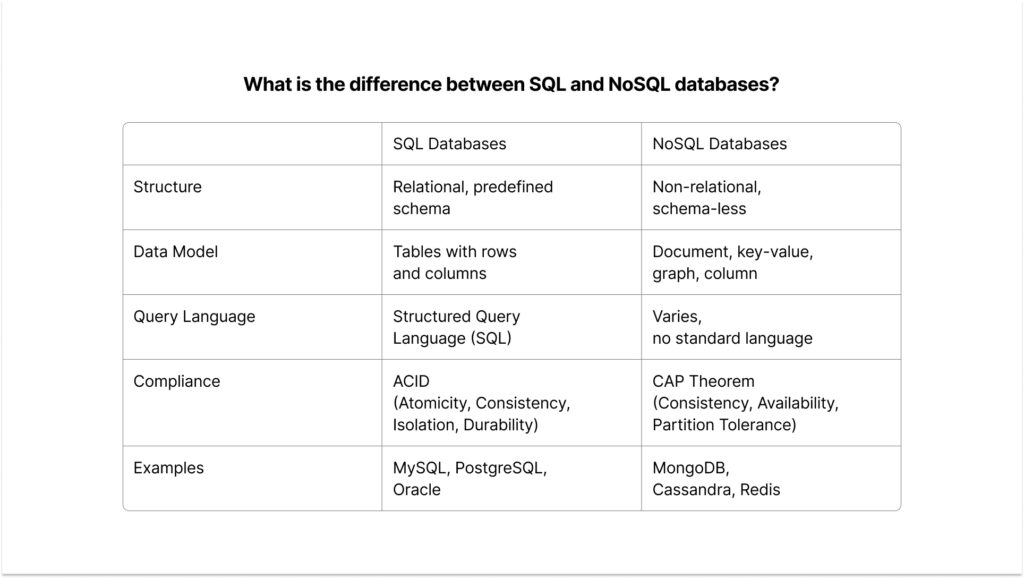
Q23) What is the difference between SQL and NoSQL databases?
Here is a table summarizing the difference between SQL and NoSQL databases:
How Much Does a Data Analyst Make in the U.S.?
To address this question, our team gathered data from various sources like Glassdoor and Salary.com to develop a comprehensive table showing the average salary ranges for a variety of Data Science roles and levels in the U.S.
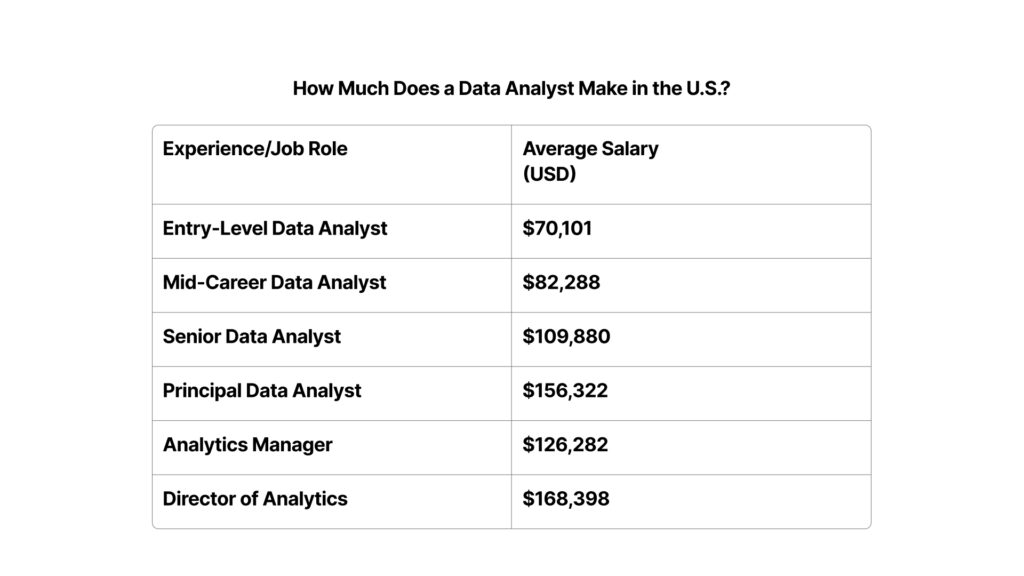
In addition to the base salaries listed above, additional compensation / bonuses can range from $1,000 to $15,000 annually.
Data Science Job Trends in 2024

The Data Science job market continues to experience robust growth and evolving demands as organizations of all stripes increasingly rely on data-driven decision-making. Here’s an expanded look at the key trends shaping the field:
Global Demand Surges
The global appetite for data professionals shows no signs of slowing down. Projections indicate that approximately 11.5 million data-related jobs will be created worldwide by the end of 2026. This surge reflects the growing recognition of data’s critical role in driving business strategy and innovation across industries.
Impressive Growth Projections
The U.S. Bureau of Labor Statistics forecasts a 25% growth in demand for Data Analysts between 2020 and 2030, far outpacing the average for all occupations. This significant increase underscores the expanding need for professionals who can extract meaningful insights from complex datasets. As businesses continue to amass vast amounts of data, the ability to analyze and interpret this information becomes increasingly valuable.
Evolving Skill Requirements
As the field matures, employers are seeking candidates with a diverse skill set. Beyond proficiency in statistical analysis and programming languages like Python and R, there’s an increasing emphasis on:
- Machine learning and artificial intelligence expertise
- Data visualization and storytelling abilities
- Cloud computing knowledge, particularly with platforms like AWS and Azure
- Strong business acumen and communication skills
Rapid Industry Diversification
While the Tech and Finance sectors continue to be major employers of Data Scientists, other industries are rapidly catching up. The Healthcare, Retail, Manufacturing, and government sectors are increasingly leveraging Data Science to optimize operations and improve decision-making processes.
As organizations continue to recognize the value of data-driven insights, the demand for skilled Data Scientists is expected to remain strong for the foreseeable future. Data Scientists who stay current with emerging technologies and develop a well-rounded skill set will be well-positioned to capitalize on these opportunities.
Let VALiNTRY Help You Kickstart Your Data Analyst Career
Entry-level Data Analysts are at the forefront of helping organizations make data-driven decisions and they play an important role by transforming raw data into actionable insights, driving business growth and efficiency.
And although there is significant demand for entry-level Data Science professionals, finding a position that matches you as a candidate to an organization’s need and culture can be challenging.